|
CA Transportation Plan 2050, (CTP) Has no "desired
outcome of increasing vehicle throughput"
(see below)
The Plan stresses a "Multi-Modal solution" to our traffic problems, including
rail. Translated:-
divert much needed money away from the most
cost-effective solution. - Away from Freeway and more towards rail, instead.
ANY development, even Transit Orientated
Development, will increase traffic and thus contribute to congestion and air
pollution, even if it were 100% affordable. Why? Because so few people in
sprawled America choose rail (and bus) no matter how proximate to their home. The Plan appears to aim at reducing the freeway to a parking lot,
thus FORCING people to take transit.
Air Pollution:- According to the the Berkley
Consultant used by the Sierra Club "our analysis disclosed that deterioration in air
quality has generally worked in favor of road expansion" .
Yes, Slower
moving congested traffic creates MORE Exhaust Air Pollution
There will be no "MOBILITY" while there is congestion and if "CHOICES" are
not prioritized on cost effectiveness then we will
be wasting the little money we have on ineffective Transit
projects instead of freeway and the
Rapid Bus that
can use it.
If we don't learn the
Transit mistakes that so many other governments have made
in the past then we will throw away our
money Cost-Ineffective Rail and Ferry. And history
will continually repeat itself.
THE PLAN
 |
|
Projected Increase in
Transit Passenger Miles Traveled, PMT
(in millions)
|
1990 |
1997 |
% |
| Los Angeles |
2,103 |
2,257 |
7 |
| Riverside-
SanBernardino |
48 |
116 |
142 |
| Sacramento |
98 |
124 |
26 |
| San Diego |
380 |
445 |
17 |
| San Francisco- Oakland |
2,030 |
2,051 |
1 |
| San Jose |
188 |
219 |
17 |
Source: California Urban Travel Trends from 1990-1997
The Road Information Program, May
|
| According to the Federal Highway
Administration, nearly half of Californias urban highways are currently
congested. This is 65 percent greater than the national average. On-road
vehicle miles
traveled per year in California is projected to increase from approximately
307 billion miles in 2000 to 475 billion miles by 2020 a 55 percent increase. The
number of on-road vehicles is projected to reach almost 35 million, up from
about 23 million in 2000. |
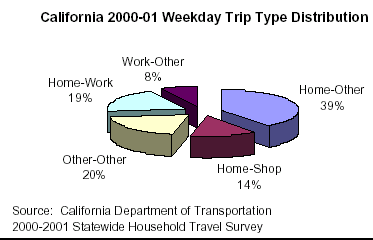
the number of
non-work trips has
overtaken the number of commuting trips.
This has led to increased use of road networks for non-work trips, thus
increasing congestion during off peak periods. Non-work trips do not cluster
around peak periods of the day and are not geographically predictable.
Because of the unpredictable nature of non-work trips,
privately owned vehicles best serve them.
There are a number of potential causes for the increase in non-work trips,
including the rise of consumer culture resulting in increasing shopping,
entertainment, and recreational trips; |
So let the expenditures on Roadways v Transit
be proportional to these projections. In LA and San Francisco:- Spend
55% on Roadways and between 1 and 7 %
on Transit. Nevertheless, the
Plan earmarks half the resources to transit enhancements and capacity
improvements, including ferry projects.
PERFORMANCE MEASURES
Transportation planners and providers must make sure they are using the
appropriate performance measures and that the data is reliable. For example,
past transportation efficiency may have been measured by the number of vehicles
flowing through the system. This assumed that increased vehicle throughput was the desired outcome. However,
if enhanced mobility and accessibility is the objective, measuring the
accessibility of people, goods, and services makes more sense.
| Relationship Between CTP Vision & Goals and System
Performance |
The $25 Billion Bullet Train -
Sacramento to San Diego
UC Berkeley Civil Engineer Professor Adib Kanafani: "High-Speed Rail
makes more sense in Japan and Europe, with their greater population
densities and mass transit networks feeding the Bullet-Train Stations.
Studies from several years ago showed that high speed rail would require
more tax-payer subsidies than airlines and highways. This is not the place
to put our money. If California is going to borrow $10 billion and
eventually pay $25 billion, it should spend it on education, job creation
and the environment."
Unlike any time in the past,
security
of rail systems must be a major consideration. They have become easy
targets. A high-speed system would provide more casualties than air travel
which will soon become safer than rail.
The easily accessible and extensive rail system will be close to impossible
to protect.
Contact your
representatives click on "Find my District"
officials: Listened to the
technical experts and
rejected the
$9 billion BOND
asked in Nov 2004 ballot |
| CTP Vision &
Goals |
System
Performance |
Indicator |
Status |
Improve
Mobility and
Accessibility |
Mobility
Accessibility
Reliability |
Travel Time Delay
Access to Desired Locations
Access to System
Variability of travel time (expected vs. actual travel time) |
Fully tested
Included in some Regional Transportation Plans
Fully tested for aeronautics, highways and transit |
Maximize
Efficient Use
of Resources |
Sustainability
(Environmental
related) |
Fuel usage per person mile
Fuel usage per ton moved |
Testing ongoing |
Reflect
Community
and
Environment
al Values |
Sustainability
(Social Equity
related)
Environmental
Quality
|
Emissions
Noise Levels
Species, Wetlands, etc
|
Fully tested
Included in some Regional Transportation Plans
|
Mobility and accessibility
Projections indicate that by 2020, California will have 45 million residents,
with 34 million registered on-road vehicles. Due to environmental, physical, and
fiscal limitations, building new roadway
facilities alone cannot provide for the anticipated demand.
We must manage the system safely and efficiently, provide attractive and
convenient transportation choices, and increase
connectivity among all modes. Providing transportation choices will help provide
a more balanced transportation system, and reduce roadway
congestion and environmental impacts. It will also provide options for
those who can drive, and provide accessibility for those who cannot or choose
not to drive. Transportation choices can only be effective if land-use
decisions support them, such as:
Street designs that encourage walking and biking
Urban designs that facilitate use of public transit
Mixed-use zoning to improve accessibility to services and
destinations
Higher densities, and
buildings designed to encourage after-work activities.
These are components of smart growth planning . The
volume of goods moving by all modes within and through California should double
by 2020. Transit systems serving adjacent jurisdictions should be
complementary in scheduling, fare structure and collection, and service.
Integrating land-use planning and providing transportation choices should lead
to a more balanced transportation system,
reduce congestion on roadways, and improve
accessibility for all.
System Improvements
Increase capacity of all modes, such as adding
more lane miles and runways, and expanding transit service
areas and hours.
Improve connectivity among all modes to help mobility and accessibility, and
improve balanced use of the system.
Integrate bicycle and walking facilities into transportation designs and
circulation plans.
Improve urban, commuter, and intercity passenger
rail
transit connectivity and extend
service hours.
Strategically locate transit stops and provide services in or adjacent to
stations to improve public transit convenience and
ridership.
Provide or expand dedicated guideway,
rapid transit
bus
service and facilities, smart shuttles, and shared-car programs
such as CarLink.
Improve multi-modal ground access to airports, including intercity bus service connecting small
urban and rural communities to passenger air service, to reduce congestion and
improve convenience.
User Fees may be an important element of urban
freeway demand management.
Land-Use
Provide incentives for jurisdictions to foster smart
growth development in areas where transportation infrastructure can
readily support it.
Provide grant programs or other incentives for local governments to
strategically increase densities and designs that promote effective transit
service, including transit-oriented
development.
Encourage the availability of Location Efficient Mortgage (LEM) programs that
consider the reduced household transportation expenses of locating in a
community well served by transit and local services
when determining mortgage levels. LEMs support
transit-oriented development and revision of zoning ordinances to allow
for mixed-use development.
Constitutional Amendment
to lower the
vote threshold to 55 percent for local revenue initiatives to support local transportation
priorities, linked to integrated community and regional planning.
Technology
Promote the use of advanced communications, such as teleconferencing,
electronic shopping, and e-government services, to increase accessibility and
reduce the need for physical travel.
Collaborate with public and private sectors to develop and implement a
universal electronic payment system for transit fares, toll collection, parking
fees, bicycle lockers, etc.
Encourage the further development and acceptance of vehicle navigation systems
to improve mobility.
System
Reduce congestion and demand by promoting a shift
to environmentally preferable transportation solutions, such as pedestrian
travel, bicycling, mass transit, and virtual
travel.
Land-use Impacts on Transportation: To
maximize resources and minimize impacts on the states natural environment,
land-use decisions and transportation must be more closely linked in the future.
Californias 58 counties and 476 cities
will need to collaborate on a regional basis to plan,
manage, and operate infrastructure to maximize resources and sustain their
economy, environment, and quality of life.
Source
http://www.dot.ca.gov/hq/tpp/offices/osp/ctp AB 857 (Chapter 1016,
approved Sep 2002) also seeks to promote infill
development, reduce the rate of urban sprawl
Tell them if they got it right by completing the questionnaire. Your comments are important and you
can make a difference.
|

