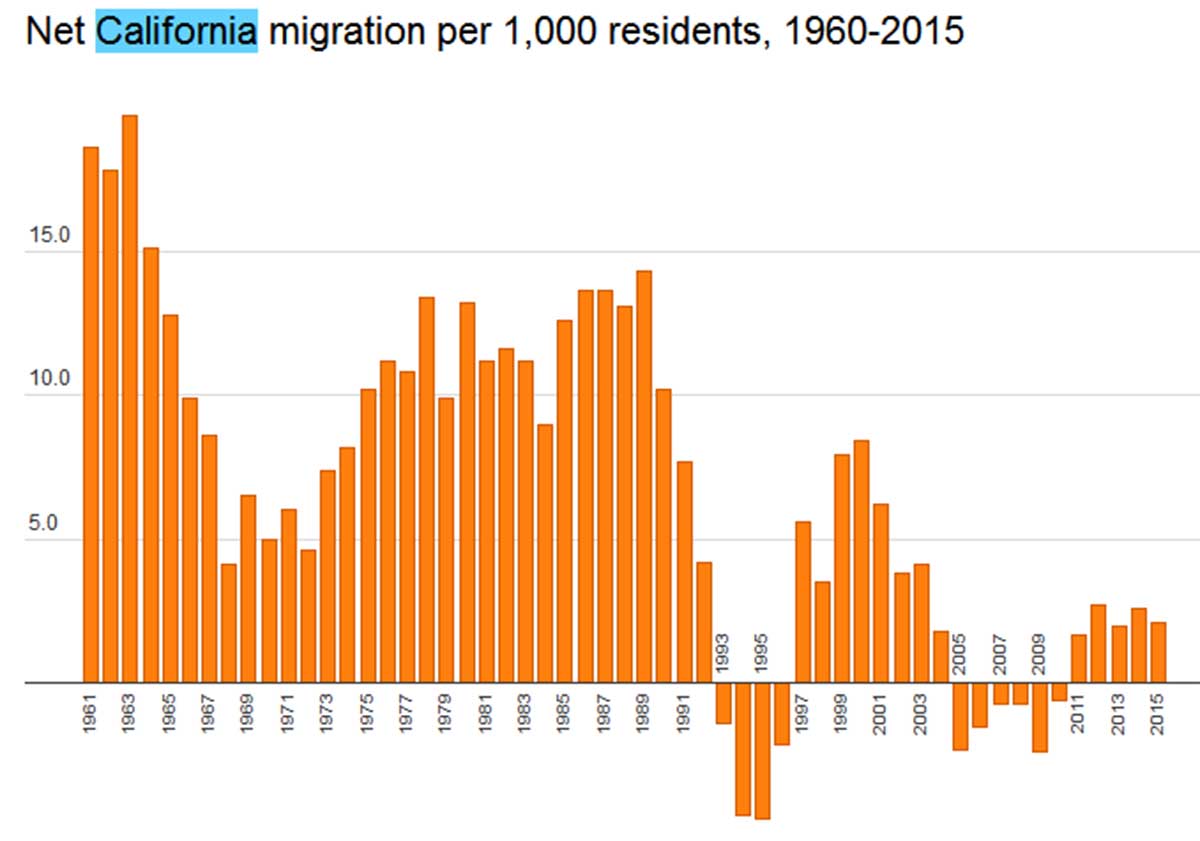
Between 2004 and 2011 more people left California than entered !!

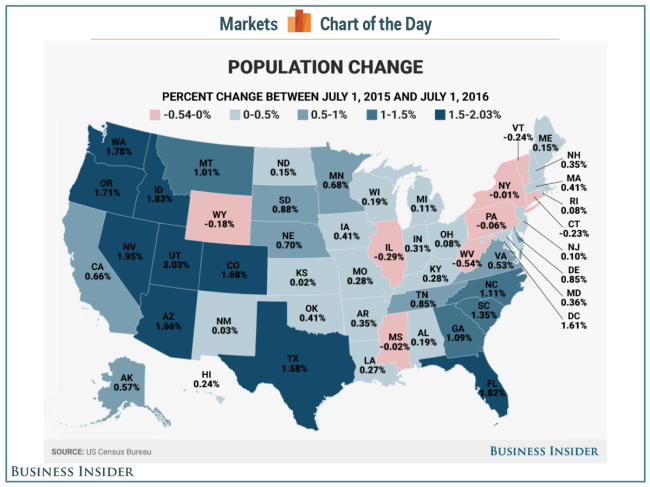
From July 2015-2016 California expands only 0.66% compared to the average of all
its surrounding States of 1.8%

Direct and Indirect Contribution of Immigration to California’s Population
Growth
1 April 2000 - 1 April 2010
(based on USC, Population Dynamics Research Group, Feb. 2011)
|
Growth due to
Native
Born |
Growth due to
Foreign
Born |
Total1 |
|
Births2 |
2,975,700 |
2,474,300 |
5,450,000 |
|
Deaths3 |
-1,720,200 |
-629,800 |
-2,350,000 |
|
Net domestic migration4 |
-1,370,000 |
-260,000 |
-1,630,000 |
|
Foreign-born immigration |
0 |
2,580,000 |
2,580,000 |
|
Foreign-born emigration |
0 |
-590,000 |
-590,000 |
|
Net native migration5 |
-70,000 |
0 |
-70,000 |
|
Total Growth |
-184,500 |
3,574,500 |
3,390,000 |
|
Percentage Share |
0% |
100% |
100% |
|
|
|
Notes:
-
Numbers under Total from John Pitkin & Dowell Myers,
“The 2010 Census Benchmark for California’s Growing and Changing
Population,” Page 8, Table 1, February 2011. University of Southern
California, Population Dynamics Research Group.
http://www.usc.edu/schools/price/research/popdynamics/pdf/2011_Pitkin-Myers_CA-2010-New-
Benchmark.pdf
-
Percentages of births to Native-born mothers
(54.6%) and Foreign-born mothers (45.4%) are the averages from 2000 to
2010. Data from State of California, Department of Public Health,
“Number and Percent of Live Births with Selected Demographic
Characteristics by Race/Ethnic Group of Mother (By Place of Residence).”
Table 2-7 in Vital Statistics of California. Years 2000-2010.
http://www.cdph.ca.gov/data/statistics/Pages/StatewideBirthStatisticalDataTables.aspx
-
Percentages of deaths of Native-born persons
(73.2%) and Foreign-born persons (26.8%) are the average percentages of
the native-born and foreign-born in the California population from 2000
to 2010. Data from State of California, Department of Finance,
Current Population Survey: California Two-year Average Series: March
2000- 2011 Data. Sacramento, California, November 2011.
http://www.dof.ca.gov/research/demographic/reports/documents/CPS_2YearReport_2000-2011.pdf
Note: this is a conservative assumption that tends to overstate deaths
to the foreign born and thereby lower their contribution to population
growth. Foreign-born persons in California live longer than native-born
persons and do not contribute as many deaths annually in proportion to
their population share (Hans P. Johnson and Joseph M. Hayes, “The
Demographics of Mortality in California,” Public Policy Institute of
California, California Counts Vol. 5, No. 4. May 2004).
Nevertheless, since the actual percentages of deaths by nativity are not
generally available, this conservative assumption is used in this
calculation.
-
Table 1 in Pitkin & Myers (see Note 1).
-
Table 1 in Pitkin & Myers (see Note 1). Net
native migration includes born abroad of American parents, Armed Forces
overseas, and migration to and from U.S. possessions.
|
|
|

