|
|
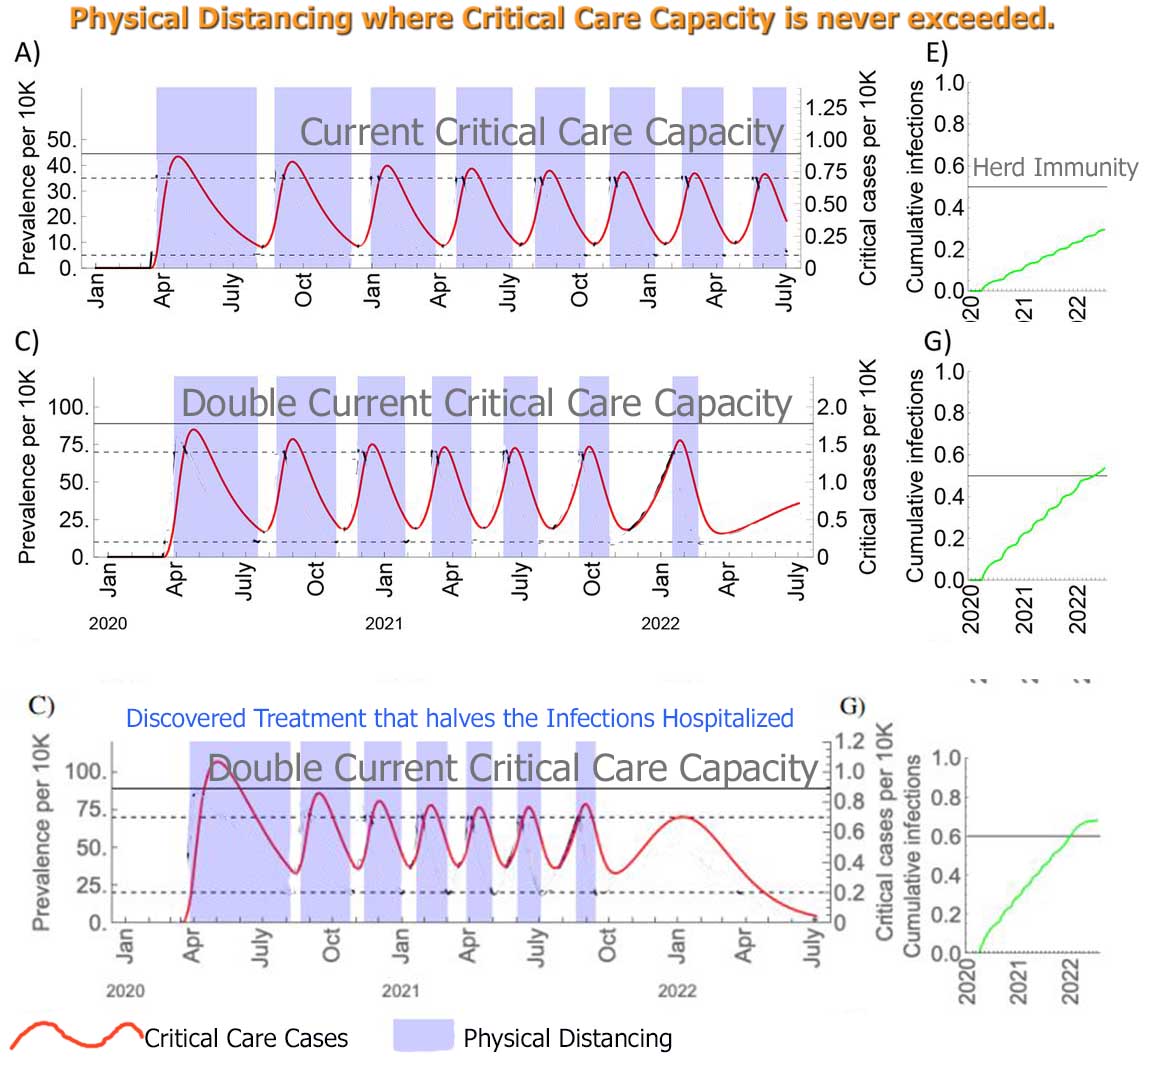
The above scenarios show that even
with:-
HERD IMMUNITY will not be reached
till 2022 when:- |
|
Jan 1st 2021 Israel has distributed the first of two vaccine doses
to more than 10 percent of its population. Israel’s heavily digitized,
community-based health system — all citizens, by law, must register with
one of the country’s four H.M.O.s — and its centralized government have
proved adept at orchestrating a national inoculation campaign.
|
-
Testing & Contact Tracing &
Quarantining mostly fails ( April 4th - Singapore's prime minister
“despite our good contact tracing” the authorities have been unable to
ascertain the origin of nearly half its new cases.)
-
A Vaccine is a minimum of 12 months
away and
-
the chance of the Vaccine being no
more than 50-70% successful at best is high and
-
the time to get 350 million people
inoculated
-
the chance of the virus mutating so
that a different vaccine is required in 2021
probably makes little difference to this
prediction of having enuf people immune to allow
near back-to-normal by 2022 at the earliest !
The Physical Distancing is as
extensive as that implemented in April 2020 !
All over this Study is mention of Cross
Immunity between the 2 BETA COMMON Coronaviruses. And possibly
between those 2 and COVID-19 !
" The Cross Immunity that HCoV-OC43
infection induces against HCoV-HKU1 is
stronger than the reverse ( 70%)". ...
"mild
(30%) cross-immunity from
HCoV-OC43
and
HCoV-HKU1
could effectively
eliminate
the transmission of
SARS-CoV-2 for up to three years"
Could there be Cross Immunity from the Common BETA
Coronaviruses ( that cause the Common Cold) to COVID-19?
I'll so gladly catch this Cold if there is!!!
COULD THIS BE A TREATMENT? ( see
below for info on all 7 Coronaviruses)
SOURCE Harvard April 14th
Model As of
April 29th from U Washington
source
(Deaths by Aug 4th - Assuming full social distancing through May 2020)
| |
Predicted
Deaths per 100k Apr8 # |
Deaths by
Aug 4th |
Invasive ventilators needed |
Peak ICU Bed shortage |
Peak Bed shortage |
ICU beds available |
Beds available |
Physical Distancing may relax ^ |
Peak in Deaths |
STAY AT HOME Order |
Educational facilities closed |
Non-essential services closed |
Travel severely limited |
|
USA |
|
72,433 |
16,966 |
*8,778 |
*2,877 |
|
|
|
15-Apr |
|
|
|
|
|
UK |
|
27,100 |
6,780 |
3,543 |
0 |
3,543 |
27,514 |
|
9-Apr |
23-Mar |
23-Mar |
20-Mar |
no |
|
Sweden |
|
17,337 |
3,988 |
3,711 |
9,810 |
658 |
4,508 |
|
22 May |
none |
none |
none |
no |
|
New York |
4 |
24,314 |
5,853 |
5,507 |
6,941 |
718 |
13,010 |
29 May |
8-Apr |
22-Mar |
18-Mar |
20-Mar |
no |
|
Connecticut |
3.9 |
3,315 |
981 |
968 |
1,752 |
100 |
1,739 |
21 Jun |
25-Apr |
none |
17-Mar |
23-Mar |
no |
|
New Jersey |
3.2 |
7,246 |
2,531 |
2,283 |
1,310 |
465 |
7,815 |
29 May |
9-Apr |
21-Mar |
18-Mar |
21-Mar |
no |
|
Massachusetts |
3.1 |
5 ,634 |
1,152 |
875 |
0 |
277 |
4,848 |
22 Jun |
19-Apr |
none |
17-Mar |
24-Mar |
no |
|
Rhode Island |
2.9 |
468 |
125 |
94 |
0 |
42 |
795 |
22 Jun |
17-Apr |
28-Mar |
16-Mar |
none |
no |
|
N. Dakota |
1.9 |
136 |
21 |
0 |
0 |
86 |
1,545 |
16 Jul |
13-May |
none |
16-Mar |
none |
no |
|
Louisiana |
1.5 |
2,026 |
607 |
194 |
0 |
477 |
7,204 |
26 May |
13-Apr |
23-Mar |
16-Mar |
22-Mar |
no |
|
Michigan |
1.3 |
3,920 |
1,111 |
495 |
0 |
742 |
10,154 |
21 May |
23-Apr |
24-Mar |
16-Mar |
23-Mar |
no |
|
S Dakota |
0.9 |
356 |
104 |
? |
? |
74 |
1,805 |
? |
14-May |
none |
16-Mar |
none |
no |
|
Florida |
0.7 |
1,898 |
1,041 |
0 |
0 |
1,695 |
20,184 |
22 Jun |
26-Apr |
3-Apr |
17-Mar |
none |
no |
|
Washington |
0.6 |
877 |
232 |
0 |
0 |
341 |
4,907 |
2 Jun |
5-Apr |
23-Mar |
13-Mar |
25-Mar |
no |
|
Alabama |
0.6 |
294 |
74 |
0 |
0 |
474 |
5,743 |
21 May |
21-Apr |
4-Apr |
19-Mar |
28-Mar |
no |
|
Iowa |
0.6 |
302 |
67 |
0 |
0 |
246 |
4,297 |
16 Jun |
2-May |
none |
4-Apr |
none |
no |
|
Oklahoma |
0.6 |
271 |
74 |
0 |
0 |
467 |
5,457 |
? |
21-Apr |
none |
17-Mar |
1-Apr |
no |
|
Wyoming |
0.6 |
36 |
12 |
0 |
0 |
44 |
1,069 |
3 Jun |
8-May |
none |
19-Mar |
none |
no |
|
Tennessee |
0.4 |
227 |
65 |
0 |
0 |
629 |
7,812 |
? |
14-Apr |
2-Apr |
20-Mar |
30-Mar |
no |
|
S. Carolina |
0.3 |
361 |
71 |
0 |
0 |
405 |
4,680 |
16 Jun |
22-Apr |
7-Apr |
16-Mar |
none |
no |
|
California |
0.2 |
2,104 |
658 |
0 |
0 |
1,994 |
26,654 |
21 May |
22-Apr |
19-Mar |
19-Mar |
19-Mar |
no |
|
Texas |
0.2 |
1,288 |
273 |
0 |
0 |
2,259 |
28,633 |
14 Jun |
28-Apr |
2-Apr |
19-Mar |
none |
no |
|
Utah |
0.2 |
317 |
93 |
0 |
0 |
170 |
2,771 |
6 Jul |
10-May |
none |
16-Mar |
none |
no |
* Peak on April 15 --
#
SOURCE ^
possible with testing, contact tracing, isolation, and limited gathering
size
1918 flu pandemic killed more people than Alabama could count! --
Stanford on 1918 Flu:
https://virus.stanford.edu/uda/
Results of 2 Different Intervention Combinations. STUDY
Summary,
ORIGINAL STUDY(not peer reviewed),
We’re not going back to normal
81% of the
populations of both UK and US would be infected, resulting in 510,000
deaths in Great Britain and
2.2 million in the US.
Demand on
intensive care
beds
would be
30 times greater than the availability,
with capacity "exceeded as early as the
second week in April".
How interventions could impact available
Intensive Care Beds. Chart B is a close-up.
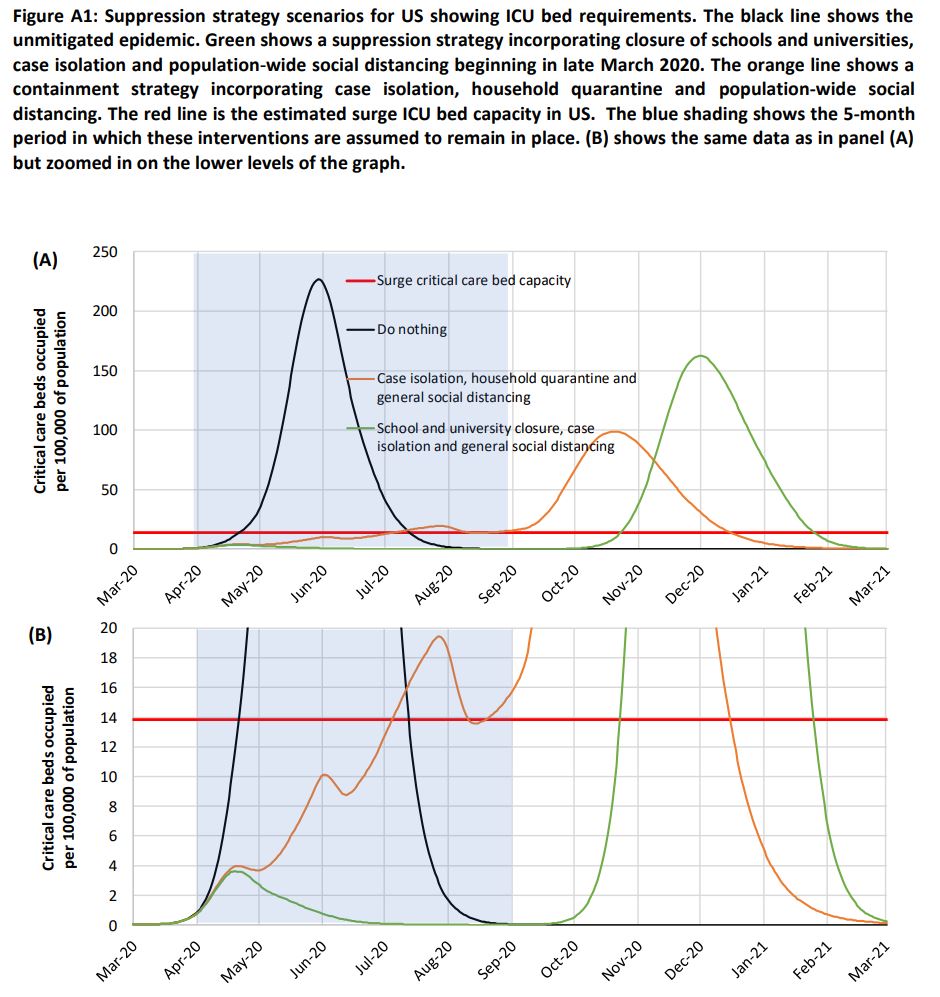
Image: Imperial College COVID-19 Response Team
While both strategies pose challenges, the scientists found that SUPPRESSION
measures:-
-
Home Isolation of those with symptoms and others in the household
and
-
Social distancing
-
Closure of Schools and Universities
would reduce deaths by half and peak healthcare demands by two-thirds.
But the outbreak would still result in 250,000
deaths in Britain, and 1.1 to 1.2
million in the US, with the 'surge capacity' of
intensive care units overwhelmed "at least
8 times greater than the availability".
Even if you set factories to churn out beds and ventilators and
all the other facilities and supplies, you’d still
need far more nurses and doctors
to take care of everyone. We need to train people to assist nurses,
and we need to get medical workers out of retirement.
There is no guarantee that initial
vaccines will have high efficacy.
Similarly we can have millions of Test Kits available but we don't have enuf
Protective Equipment to make those tests.
In the US, after May, 95% will still have not been
exposed to this virus !
source
Wouldn't the best approach be to Isolate the Elderly and the
Vulnerable for 6 to 9 months and let everyone else carry on as normal ?
Creating Herd Immunity the fastest
(beyond Doing Nothing).
But our hospitals are so woefully under equipped ( Mar 19)-- too many
would STILL die in this first phase because
38 percent of those sick enough to be hospitalized were younger than
55.(preliminary data)
-- no doubt with one or more of these pre-existing
conditions and they are resistant to isolation.
The Elderly and Vulnerable must:-
-
Stay at home or
keep away from people outdoors and never go anywhere else indoors other
than home.
-
Never let
anyone IN their home ( talk to visitors thru glass or have them stay 10
feet away from the door, downwind)
-
Shop
online for Food Delivery or with neighborhood help (from younger healthy
people). Food dropped outside door.
-
Try to avoid being infected at the peak where hospitals
may not have enough resources ( beds + ventilators) for everyone.
-
Receive Financial Aid.
|
| |
|
|
|
March 2020: COVID-19
(Coronavirus) Wuhan, China has already surpassed the death tolls of
SARS and MERS,
over 3,000 (Mar 9th 2020).
Mutations &
Immunity
But
The strains
of the virus infecting people in the U.S. have only about
6 to 10 slightly different genetic variations
between the strain that emerged in Wuhan, China.
"That's a relatively small number of mutations
for having passed through a large number of people," , "As of Mar 25th the
mutation rate of the virus would suggest
that the vaccine developed for it would be a single
vaccine, rather than a new vaccine every year
like the flu vaccine."
source
"Barcode" Genetic Evolution The two parts of the virus
that seem not to be mutating are the ones responsible for its
entry into healthy cells and packaging its RNA,". "Both of these are
important targets for understanding the body's immune response, identifying
antiviral therapeutics and designing vaccines."
NYT April 30th How the virus Mutates and Spreads
In the future, the virus may pick up some mutations that help it evade
our immune systems. But the slow mutation rate of the coronavirus means
that these changes will emerge over the course of years.
That bodes well for vaccines currently in development for Covid-19.
If people get vaccinated in 2021 against the new coronavirus, they may well
enjoy a protection that lasts for years.
One study
conducted by Taiwanese researchers found that survivors of the
SARS had antibodies that lasted for up to three years—suggesting immunity. Survivors of
MERS were found to last just around a year.
The degree of immunity could also differ from person to person depending on
the strength of the patient’s antibody response.
Younger, healthier people will likely generate a more robust antibody
response, giving them more protection against the virus in future.
Symptoms
Symptoms for
the COVID-19 ( 80% mild or no-symptoms):
-
Fever (83-98%)
-
Cough (46-82%, usually dry)
-
Shortness of breath at onset (31%)
-
Myalgia or fatigue (11-44%)
But
symptoms can get worse over several days,
rather than quickly like the flu.
The
incubation period is
6.4 days after exposure. (only 2.5% will NOT show symptoms
after 11.5 days)
W.H.O says:
Can be transmitted in areas with
hot
and
humid
weather
Flu
Symptoms: fever* or feeling feverish/chills, cough, sore throat,
runny or stuffy nose, muscle or body aches, headaches, fatigue, some people may have vomiting and diarrhea, though this is more
common in children than adults.
*not everyone will have a fever.
Contagion
Detailed examples of Infection thru the air
Contagious for
14 days after showing symptoms?
STUDY: The time from infection to onset of symptoms (incubation period)
was five days among all but one patient. The average duration of
symptoms was eight days, while the length of time patients
remained contagious after the end of their symptoms ranged from one to
eight days.
STUDY Mar 20:-
asymptomatic
or mild cases combined represent about 40–50% of all infections. “can be
highly contagious when they have mild or no symptoms”,
STUDY Mar 16:-
86% of infections had
unobserved
symptoms. And per person, these infections were 55% as contagious as
observed
symptoms infections.
Due to their greater numbers,
unobserved
symptoms infections were the
infection source
for 79% of
observed
symptoms cases.
Undiagnosed COVID-19 — appear to fuel the rapid spread of the disease
Mar 8th:- A new study at medRxiv.org of nine people who
contracted the virus in Germany suggests that people are mainly contagious
before they have symptoms and in the first week
of the disease.
Infectious viruses were isolated from nose and throat swabs and phlegm
samples during that first week.
Patients produced thousands to millions of viruses in their noses and
throats, about 1,000 times as much virus
as produced in SARS patients which
explain why
COVID-19 is so
infectious.
When you are mildly ill or
just getting sick, you’re putting out a
whole lot of virus.
After about 10
days or so, you’re not likely to be
infecting other people.
even though children typically only exhibit mild symptoms if infected, they
can shed the coronavirus long after symptoms disappear.
COVID-19 will infect 2.5 people on average compared with 1.5 for the Flu.
----
three times as infectious as flu
The most serious complication of COVID-19 is a type
of pneumonia that’s been called 2019
novel coronavirus-infected pneumonia (NCIP).
Results from a 2020
studyTrusted
Source of 138 people admitted into
hospitals in Wuhan, China with NCIP
found that 26% of those admitted had severe cases and needed to be treated
in the intensive care unit (ICU).
About 4.3% of these people who were admitted to the ICU died from this type
of pneumonia.
So far, NCIP is the only complication
specifically linked to the 2019 coronavirus.
W.H.O says - Even if you've been PCV13
Pneumonia vaccinated it will make
no difference.
Other complications (source):
Feb 11th:
China CDC’s analysis of 44,672 patients (more
than 36,000 — or 81 percent — were mild) found that this was the fatality rate in patients who reported:-
- 0.9%
- no other health conditions
- 10.5% -
cardiovascular disease
- 7.3%
- diabetes
- 6.3%
- chronic respiratory diseases such as COPD
- 6.0%
- hypertension
- 5.6%
- cancer
- 2.6% - missing?
Some of the
most serious symptoms of Covid-19 result from an
immune system on the
rampage.
Chinese scientists found: An extreme immune response called
cytokine storm,
a flood of immune cells and the biochemicals they produce,
tears through lung
tissue.
(Possible
Treatment:
anakinra, a cytokine-targeting therapy)
see How
COVID-19 can kill
see
TABLE 1
source StatNews
source ChinaCDC:
A couple of deadly Human
Coronaviruses:-
- SARS (Severe
Acute Respiratory Syndrome.)
Nov 2002 Guangdong province in southern
China.
8,098 people were infected, and 774 died. It spread to 24 countries.
Death Rate: 9.5%
Declared Under Control and stamped out, in 6 months,(July 2003) by
- International Cooperation and
- strict, Public Health measures like
- Isolation,
- Quarantine and
- Contact Tracing.
Came from civets(a member of
Mongoose family) infected by
bats
But the COVID-19 has much milder symptoms in
most cases, making it harder to catch and isolate.
- MERS, (Middle
East Respiratory Syndrome),
first reported in Saudi Arabia in 2012.
2,494 cases, with 858 deaths, in 27 countries.
Death Rate:34%
Came from camels infected by
bats
Other Viruses
Flu:- In the
US in 2016-2017:- 29 million illnesses, 500,000 hospitalizations
and 38,000 deaths. A
Death Rate of 0.1% but over 65 it's 0.83%
H5N1 is a variant of influenza,
previously only infected birds.
- It was discovered in August, 2003. The Chinese
government swiftly killed 1.5 million chickens .
- Further cases were closely monitored and isolated.
By the end of the year there were 18 known cases in humans. Six people
died.
- This was seen as a successful Global Response, and
the virus was not seen again for years.
- Containment was possible because people who got it
became extremely ill.
- Fatality Rate of 60%.
Yet since 2003, the virus has killed only 455 people.
Ebola, has surged
in Africa and has a much higher fatality rate than COVID-19. |
|
WHO Situation Reports ---
Deaths per 100k per State -----
Drug Trials LOCAL
Deaths by Age of those Hospitalised
CDC Modeling
News
April 28th How we must do CONTACT TRACING
April 23 Economist: Many more Testing Labs required -- need to spend
$15 billion per month till end of the year
and beyond - versus -- cost of the Pandemic Lockdown of
$400 billion per month.
April 22: A
mysterious blood-clotting complication is killing COVID-19 patients
April 22:
Thanks to the U.S. Food and Drug Administration’s recently relaxed rules for
coronavirus tests. "Some tests are a disaster" !
April 15th COVID-19 kills by inflaming and clogging the tiny air sacs in
the lungs, choking off the body’s oxygen supply until it shuts down the
organs essential for life.
But clinicians around the world are seeing evidence that suggests the virus
also may be causing heart inflammation, acute
kidney disease, neurological malfunction, blood clots, intestinal damage
and liver problems. The prevalence of
these effects is too great to attribute them solely to the “cytokine storm”. This is more like
MERS than SARS !
April 14th French study finds
Hydroxychloroquine doesn’t help patients with COVID-19.
84 patients who took it versus 97 who didn't.
April 7th Coronavirus patients can benefit from blood of the recovered,
new study shows
April 6th
EIDD-1931A
new antiviral drug heading into clinical trials offers hope for COVID-19
treatment
April
6th: Vitamin D could help fight off COVID-19. (A person
who rarely gets out in the sun may need vitamin D3.
Our bodies make vitamin
D from sunlight).
April 6th
study found
cardiac damage in
as many as
1 in 5
patients, leading to heart failure and death even among those who show
no signs of respiratory distress.
Infection can mimic a heart attack.
They have taken patients to the cardiac catheterization lab to clear a
suspected blockage, only to find the patient wasn’t really experiencing a
heart attack but had COVID-19.
Original Study
April 6th
Bronx Zoo tiger tests positive for COVID-19 Did you give it to your pet?
April 4th STUDY:- New study identifies characteristics of patients with
fatal COVID-19
..... "The greatest number of deaths were in
males median age 65.8. - 72.9 percent were men with conditions including
hypertension, coronary heart disease and diabetes."
80 0 percent of patients had very low counts of eosinophils (cells
that are reduced in severe respiratory infections) on admission.
Complications included respiratory failure, shock, acute respiratory
distress syndrome (ARDS) and cardiac arrhythmia, among others.
while respiratory symptoms may not develop until a week after
presentation, once they do there can be a rapid decline, as indicated by the
Short duration between time of admission and death (6.35 days) .
eosinophilopenia — (abnormally low levels of eosinophils in the
blood) — may indicate a poor prognosis
A combination of antimicrobial drugs (antivirals, antibiotics) did
not significantly help these patients. The majority of patients studied died
from multiple organ failure.
March 30th Oxygen instead of
Ventilator ?
March 30 STUDY:- One in five COVID-19 patients often infected with other
respiratory viruses, preliminary study reports. One in 10
hospital admissions who are diagnosed with a common respiratory virus, are
co-infected with the COVID-19 virus.
If there is a diagnosis of influenza or rhinovirus, or other respiratory
virus, a hospital may erroneously discharge the patient without COVID
testing."
STUDY March 27th: How to Increase Capacity?
- setting up additional beds by
- repurposing unused operating
rooms,
- pre- and postrecovery rooms,
- procedural areas,
- medical and nursing staff
quarters, and
- hallways.
- For example, in UW Medicine, the
use of such strategies has enabled planning to increase bed capacity
temporarily by 65%.
- Currently, one of the largest
constraints on effective care may be the lack of ventilators.
One supplement to ventilator capacity is using anesthesia machines freed
up by deferring or cancelling elective surgeries.
- The use of mobile military
resources including the National Guard has the potential to
address some capacity limitations, particularly given the differently
timed epidemics across states.
- Other innovative strategies will
need to be found, including the construction of temporary hospital
facilities as was done in Wuhan, Washington state, New York.
Mar 27th
Studies indicate that the official lab counts may be missing as many as 9 in
10 deaths.
Mar 19th
half of the 300 to 400 COVID-19 patients treated in ICU in Paris were
younger than 65,
and, half in the Netherlands were
younger than 50.
Original report CDC - Among 121 US patients
known to have been admitted to an ICU, of adult cases reported:
7% age ≥85,
46% aged 65–84,
36% aged 45–64,
12% aged 20–44
So finding and forced Isolation of the under 65's who have hypertension and
diabetes ( as well as everyone over 64) is what is needed with Trump's "Tweepothesis".
( include Cardiovascular disease, Chronic respiratory disease and cancer)
Mar 17th:- New York Gov. just announced that he'd
been advised that the Peak will be in 45
days ( May 11th) that would make the
end (another 45 days) at
June 25th -- a total of about
13 weeks ( This conforms to the
12-14 weeks spike of the1918 Flu Pandemic ( see below)
(Contrary to some “Experts“ that think it may spike no longer than 8 weeks.
Where a hot May-June slows the virus compared with the 1918 Flu
that peaked in Oct-Nov-Dec )
Mar 17th:- US Deaths=100 means 4,500 infected ( at
2.3%) The only useful numbers are deaths
from which you can extrapolate Infections
using 2.3% or 3.4% - If it's an Italy-like scenario so many of the
deaths are caused by lack of hospital capacity - so stick to 2.3%.
Italy’s coronavirus crisis could be America’s
Aggressive and sustained testing
gave
South Korea
1/7 the Death Rate of
Italy !
This includes enforcing a law that grants the S. Korea
government wide authority to access data: CCTV footage, GPS
tracking data from phones and cars, credit card
transactions, immigration entry information, and other personal details
of people confirmed to have an infectious disease.
The authorities can then make some of this public, so anyone
who may have been exposed can get themselves - or their friends and family
members - tested.
.....
placed in self-quarantine and monitored remotely through a
smartphone app,
or checked regularly in telephone calls, until a
hospital bed
becomes available...
South Korea’s government also uses
location data
to customize
mass messages sent to cellphones,
notifying every resident when and
where a
nearby case is
confirmed.
South Korea changed the law to allow the state to gain
access
to
medical records
and share them
without a warrant.
In normal times many democracies might find that too intrusive. Times are
not normal.
South Korea did well over a quarter of a million tests. By
the time South Korea had done 200,000 tests, we had probably done less than 1,000.
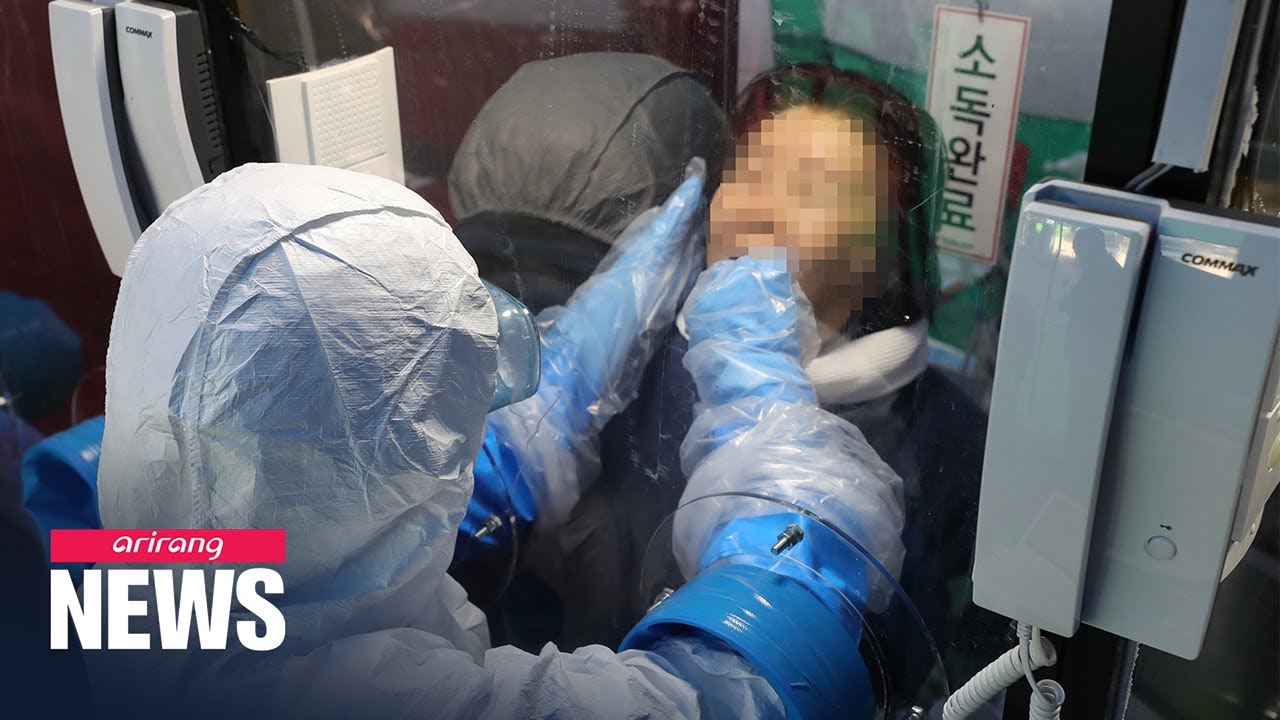
South Korea
Testing "phone booths"
video
"One person at a time can enter one side of this glass-walled booth, they
grab a handset, and they are connected with a hospital worker standing on
the other side of the glass," .
Using a pair of rubber gloves set into the wall, the health care worker can
swab the patient without potentially exposing themselves to the virus.
"The hospital is able to tell the patient their
results within seven minutes.
They don't have direct contact with a health care worker."
Mar 8th: Italy:
The
death count
tripled from 133 to 366
(from 2.3% to 5%),
and infections rose by a
single-day
record of 1,492 to hit 7,375
Taiwan reins in spread of coronavirus (March) closing its borders in
late January to most travellers from China, as well as imposing heavy
fines
on anyone found violating self-quarantine
orders, and shuttering
schools
and
universities.
Disinfectants
Use Disinfectants with
62-71% ethanol, 0.5% hydrogen peroxide or 0.1% sodium hypochlorite(bleach) .
Other biocidal agents such as 0.05-0.2% benzalkonium chloride or 0.02%
chlorhexidine digluconate are
less effective.
Homemade
virus killer.
Add
¼
cup Concentrated Regular
Bleach
to ½ gallon water, ( 1 part to 10); apply bleach solution to surface,
; let stand 5 minutes. Rinse and air dry.
Hand
Sanitizer Guide to Local Production Ethanol
96% or Isopropyl alcohol 99.8%, Hydrogen peroxide 3%,
Glycerol 98%
Drugs
There's a possibility of
drug shortages from disruptions to the pharmaceutical supply
chain in China.
“We’re very concerned about the intermingling of our supply chain with China
in particular,”
“There are 20 drugs with ingredients made
exclusively in China"
Gilead:
Study to Evaluate the Safety and Antiviral Activity of Remdesivir (GS-5734™) in Participants With Severe Coronavirus
Disease (COVID-19)
“The mistake generally made these days is to think that [just] any antiviral
would be effective against [the coronavirus]. This is, of course, not
true,”............. ..........several papers showing
that
remdesivir
is effective against SARS, MERS and related bat coronaviruses, as well as
some of the common cold
coronaviruses.
ScientificAmerican ( Fast Track for
"compassionate use")
Favipiravir
(Brand Avigan)
Virus Manufacturers ....
more on Vaccine & Drug Companies
Clinical Trials
PROBABLY JUST TRUMP HYPE
New insights on the
antiviral effects of Chloroquine against coronavirus: what to expect
for COVID-19? Brand name
Plaquenil ( in Pharmacies now. Your doctor can prescribe )
NIH
Trials on Hydroxychloroquine
Drug Trials LOCAL
Convalescent Plasma as a potential therapy for COVID-19
Several marketed drugs with excellent safety profiles such as
metformin, glitazones, fibrates, sartans, and atorvastin,
as well as
nutrient supplements
and
biologics
could reduce immunopathology, boost immune responses, and prevent or curb
Acute
Respiratory Distress Syndrome
(ARDS)
The Lancet
STUDY: An antibody that had been
taken from a SARS patient years ago and
noticed that it latched onto a specific place in that virus. The team then
discovered that the same SARS antibody
latched onto virtually the same spot on the novel coronavirus. The antibody
did not grip it quite as hard, but it helped identify the spot as a possible
weak point in the makeup of the virus.
How long is COVID-19, SARS , MERS &
Flu Infectious on Surfaces?
MIT researcher says droplets carrying coronavirus can travel up to 24
feet (8 meters)
“Respiratory droplets will undergo gravitational settling faster than
they evaporate, contaminating surfaces and leading to contact
transmission.
Smaller aerosols (=5 µm) will evaporate faster than they can
settle, are buoyant, and thus can be affected by air currents, which can
transport them over longer distances.”
Those aerosols, they say, can accumulate, remain
infectious in indoor air for hours, and be easily inhaled deep
into the lungs, allowing transmission regardless of physical distancing.
They even point to a study in hospitals in Wuhan, China, which found the
COVID-19 virus in aerosols more than two metres from patients.
COVID-19 STUDY Mar 11th:
(awaiting peer revue)
-
in the air
for up to
3 hours.
-
on
copper
for up to
4 hours,
-
on
cardboard
up to
24 hours
-
on
plastic
and stainless
steel
up to
2 to 3 days
22 studies
including SARS and MERS
concluded that the respiratory viruses can remain
infectious on surfaces for up to 9 days at room
temperature.
Dissipate faster at higher temperatures. Survive the longest in
low-temperatures.
"There's probably a very low risk of it spreading from products or packaging
that are shipped over a period of days at ambient temperatures",
said Dr. Timothy Brewer, professor of epidemiology and
medicine at the UCLA. Source Reuters
It's normally spread thru coughing or sneezing.
STUDY:-Patients with the
COVID-19 extensively
contaminate their bedrooms and bathrooms, underscoring the need to
routinely clean high-touch surfaces, basins and toilet bowls.
It's killed by twice-a-day cleaning of surfaces and daily cleaning of floors
with a commonly used disinfectant.
The Flu virus can
survive on hard surfaces for 24 hours .
As droplets in the air for
several hours; low temperatures increase their
survival in the air.
Myths
Although the virus is indeed smaller than the
N95 Mask
filter size, but the virus always travels attached to larger water particles
that are
consistently snared
by the filter. And erratic motion of particles and the electrostatic
attraction generated by the mask means they would be
consistently caught
as well.
As of
March 10,
California
can
test 7,400
people a day,
Washington
can
test 1,000
and
Oregon
can test only
40
and the
U.S.
had tested a
couple thousand
people.
Compared with
South Korea,
that is testing
20,000
people a day !
Aggressive and sustained
testing
gave
South Korea
1/7 the Death Rate of
Italy
!
COVID-19 is
more genetically related to SARS than
MERS but both are betacoronaviruses ( not
"Common") with their origins in bats.
Flu: Caused by
any of several different types and strains of
influenza viruses.
To learn from? -
The 2009 (H1N1)pdm09, (Swine Flu), Pandemic: A New Flu Virus
Emerges Death Rate of 1.28% |
The 7
Human
Coronaviruses ( Source: )
Common Human
Coronaviruses
-
229E (alpha coronavirus) causes common cold but also
severe lower respiratory tract infections in the youngest and oldest age
groups
-
NL63 (alpha
coronavirus) causes of (pseudo) croup and bronchiolitis in children.
-
OC43 (beta coronavirus) causes common cold but
also severe lower respiratory tract infections in the youngest and
oldest age groups. Short-term immunity just 40 weeks.
-
HKU1 (beta
coronavirus) causes common cold but also severe lower
respiratory tract infections in the youngest and oldest age groups (can
also cause gastrointestinal infection). Short-term immunity just 40
weeks.
Other Human Coronaviruses
-
MERS-CoV (the
beta coronavirus that causes Middle East Respiratory Syndrome, or
MERS)
-
SARS-CoV (the
beta coronavirus that causes severe acute respiratory syndrome, or
SARS)
-
SARS-CoV-2 (the novel
coronavirus that causes coronavirus disease 2019, or
COVID-19)
Two of the four
Common Coronaviruses (
Source: )
COVID-19,
is not the same as 229E or OC43 , 2 of
the 3 Common Coronaviruses, that cause the
Common Cold.
[the
most common cause
of the Cold is from many different
strains
( 800+
mutations)
of the
Rhinovirus,
responsible for over
50% of colds
and
half of all
asthma
attacks,
and is a factor in
bronchitis,
sinusitis,
middle
ear
infections and
pneumonia.]
Other viruses that can cause colds include
229E and OC43
cause 5 to 30% of “Common Colds” and
remain localized to the epithelium of the upper
respiratory tract and elicit a poor immune
response, hence the high rate of
reinfection.
There is no Cross-Immunity
between human
coronavirus-229E and human
coronavirus-OC43, ( tho there is between the 2 BETA Common
Coronaviruses) and it is likely that new strains
are continually arising by mutation
selection.
The Common Cold from 3 of the 4 Common Coronaviruses
lasts 7 days, with typical symptoms of a sore throat,
rhinorrhea, fever, cough, and headache, indistinguishable from the
common colds caused by rhinoviruses.
Asymptomatic, (fails
to show symptoms), infections are frequent .
Occasionally they cause lower
respiratory tract infections and otitis
media (middle
ear).
There is no evidence of either of these viruses causing enteric disease (intestinal)
in humans, despite the finding of coronavirus-like particles in the
stools of such patients.
There is a possibility of Cross-Immunity
between COVID-19 and the 2 Beta
Coronaviruses OC43
or HKU1, possibly explaining why fewer children
suffer from it.
COVID &
NL63
utilize the same cell receptor, namely
ACE2
229E
uses a different receptor
APN
An antibody from a patient who recovered from
SARS
has been shown to block COVID-19 infection in a laboratory setting,
August 4th 2020: "We have now proven that, in some people, pre-existing
T cell memory against
common cold coronaviruses
can cross-recognize SARS-CoV-2, down
to the exact molecular structures," "This could help explain why some people
show milder symptoms of disease while others get severely sick."
I have to assume its the
BETA's
OC43 and
HKU1 |
|
TABLE 1. Patients, deaths, and case
fatality rates, as well as observed time and mortality
for n=44,672 confirmed COVID-19 cases in Mainland China as of February 11, 2020.
|
Baseline
characteristics |
Confirmed cases,
N (%) |
Deaths,
N (%) |
Case fatality
rate, % |
Observed time,
PD |
Mortality,
per 10 PD |
|
Overall |
44,672 |
1,023 |
2.3 |
661,609 |
0.015 |
| Age, years |
|
|
|
|
|
| 0–9 |
416 (0.9) |
− |
− |
4,383 |
− |
| 10–19 |
549 (1.2) |
1 (0.1) |
0.2 |
6,625 |
0.002 |
| 20–29 |
3,619 (8.1) |
7 (0.7) |
0.2 |
53,953 |
0.001 |
| 30–39 |
7,600 (17.0) |
18 (1.8) |
0.2 |
114,550 |
0.002 |
| 40–49 |
8,571 (19.2) |
38 (3.7) |
0.4 |
128,448 |
0.003 |
| 50–59 |
10,008
(22.4) |
130 (12.7) |
1.3 |
151,059 |
0.009 |
|
60–69 |
8,583 (19.2) |
309 (30.2) |
3.6 |
128,088 |
0.024 |
|
70–79 |
3,918 (8.8) |
312 (30.5) |
8.0 |
55,832 |
0.056 |
|
≥80 |
1,408 (3.2) |
208 (20.3) |
14.8 |
18,671 |
0.111 |
| Sex |
|
|
|
|
|
| Male |
22,981
(51.4) |
653 (63.8) |
2.8 |
342,063 |
0.019 |
| Female |
21,691
(48.6) |
370 (36.2) |
1.7 |
319,546 |
0.012 |
| Comorbid
condition† |
|
|
|
|
|
|
Hypertension |
2,683 (12.8) |
161 (39.7) |
6.0 |
42,603 |
0.038 |
|
Diabetes |
1,102 (5.3) |
80 (19.7) |
7.3 |
17,940 |
0.045 |
|
Cardiovascular disease |
873 (4.2) |
92 (22.7) |
10.5 |
13,533 |
0.068 |
|
Chronic respiratory disease |
511 (2.4) |
32 (7.9) |
6.3 |
8,083 |
0.040 |
|
Cancer (any) |
107 (0.5) |
6 (1.5) |
5.6 |
1,690 |
0.036 |
|
None |
15,536
(74.0) |
133 (32.8) |
0.9 |
242,948 |
0.005 |
| Missing |
23,690
(53.0) |
617 (60.3) |
2.6 |
331,843 |
0.019 |
| Case
severity§ |
|
|
|
|
|
| Mild |
36,160
(80.9) |
− |
− |
− |
− |
| Severe |
6,168 (13.8) |
− |
− |
− |
− |
| Critical |
2,087 (4.7) |
1,023 (100) |
49.0 |
31,456 |
0.325 |
| Missing |
257 (0.6) |
− |
− |
− |
− |
| Period (by
date of onset) |
|
|
|
|
|
| Before Dec
31, 2019 |
104 (0.2) |
15 (1.5) |
14.4 |
5,142 |
0.029 |
| Jan 1–10,
2020 |
653 (1.5) |
102 (10.0) |
15.6 |
21,687 |
0.047 |
| Jan 11–20,
2020 |
5,417 (12.1) |
310 (30.3) |
5.7 |
130,972 |
0.024 |
| Jan 21–31,
2020 |
26,468
(59.2) |
494 (48.3) |
1.9 |
416,009 |
0.012 |
|
After Feb 1, 2020 |
12,030 (26.9) |
102 (10.0) |
0.8 |
87,799 |
0.012 |
Abreviation:
PD,
person-days. -, not applicable.
*
The Wuhan-related exposure variable, only includes a total of 37,269 patients
and 919 deaths and these values were used to calculate percentages in the
confirmed cases and deaths columns.
† The
comorbid condition variable, only includes a total of
20,812
patients and
504 deaths
and these values were used to calculate percentages in the confirmed cases and
deaths columns.
§ The
case severity variable, only includes a total of 44,415 patients and 1,023
deaths and these values were used to calculate percentages in the confirmed
cases and deaths columns.
source ChinaCDC:
There were a total of
72,314 patient records.
They don't include 10,567 (14.6%) clinically diagnosed cases (
patients who demonstrate
all the symptoms of Covid-19 but
have either not been able to get a test or are believed to have falsely tested
negative. )
And they omitted the 16,186 (22.4%) suspected cases.
If we hypothesis
that if the excluded 28k patients DID have COVID-19 and all recovered(
not likely) then we can
multiply the above percentages by 2/3.
Most likely some of the "MISSING" 23k, that had 2.6% deaths, did have one
of the Comorbidities?
And one would expect the severity of illness in the Pre-Existing Condition (
and age related) patients would be less likely to be missed as few of them would
be "mild".
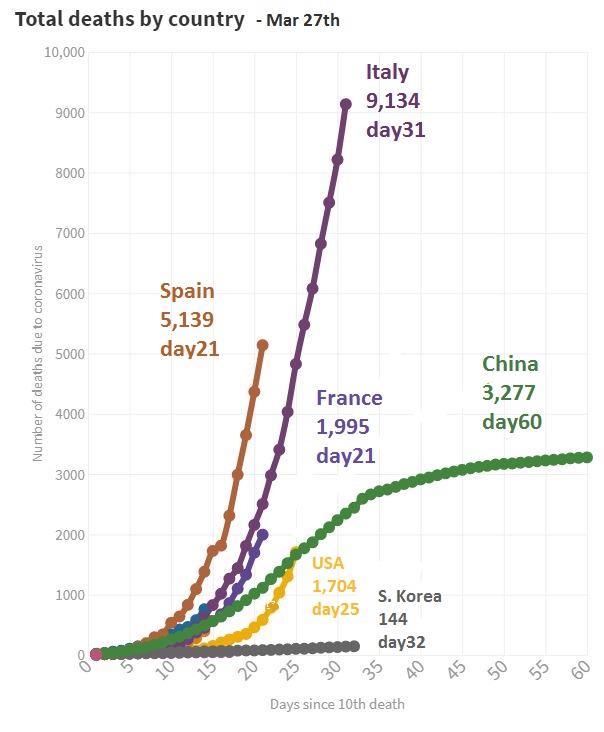
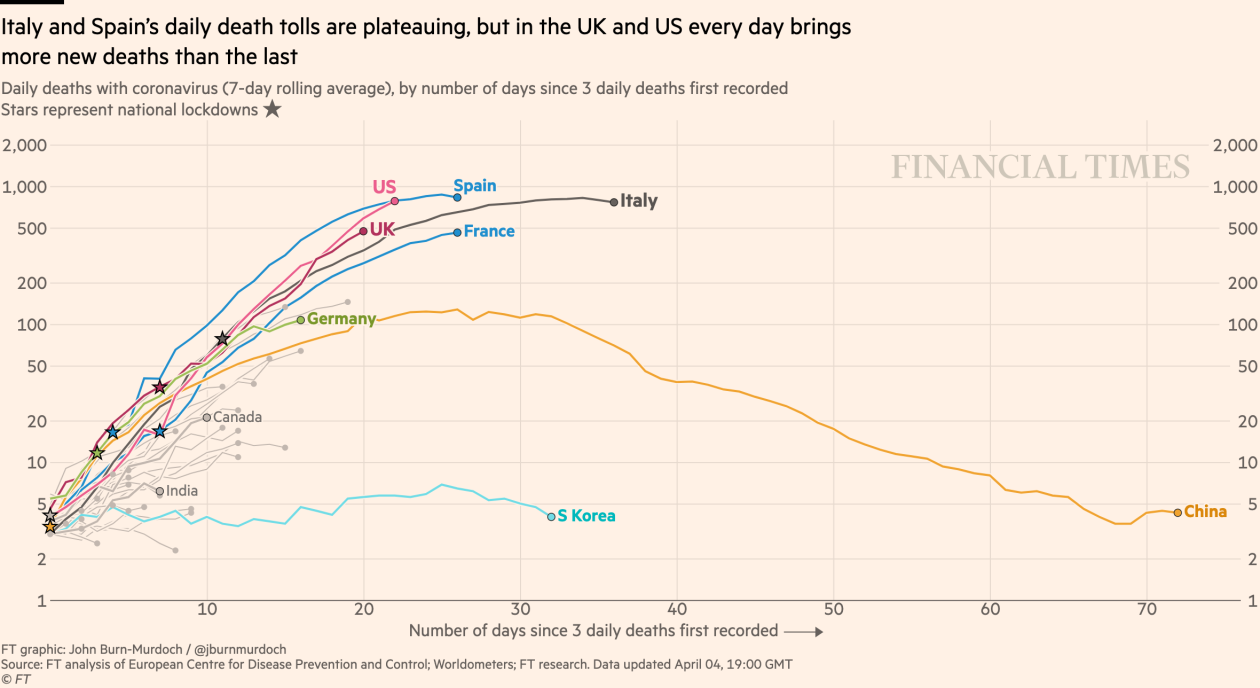
BEWARE THIS IS LOGARITHMIC !
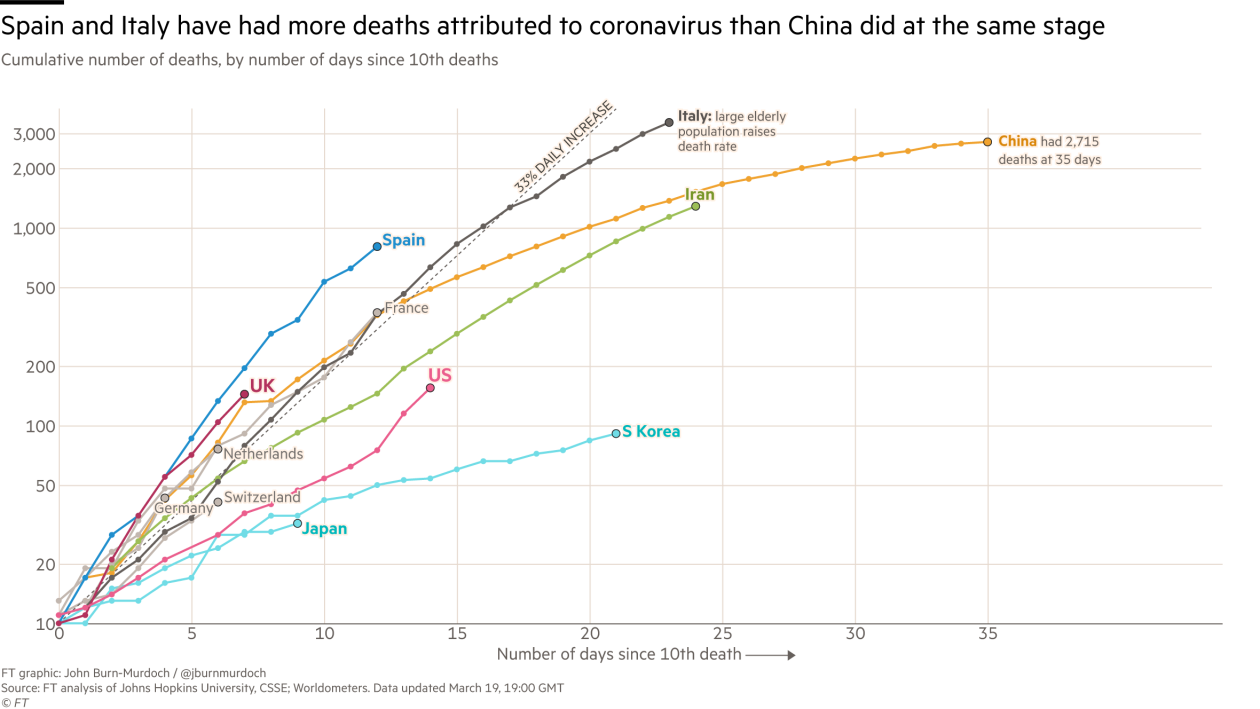
These numbers better indicate the REAL number of Infections.
On Day 35, 2,715 Deaths at 2.3% Death Rate gives 118,043 Detectable Infections,
Mar 19th
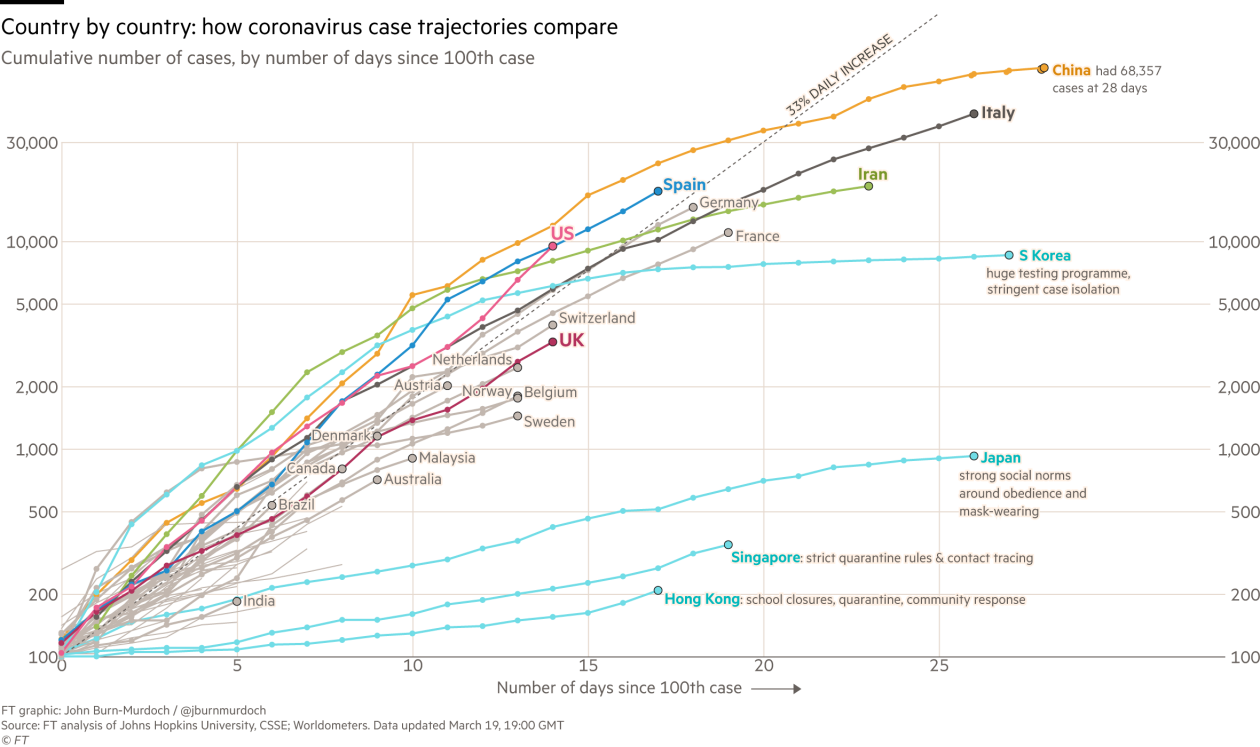
But who knows and WHO doesn't what the REAL Infection Count
is ? --
Relative Performance of US Cities during the 1918 Flu Pandemic
There were 115,340 excess pneumonia and influenza deaths in the 43 cities during
the 24 weeks analyzed.
(Excess
Death Rate,
EDR,
500 per 100,000 population)
Every city adopted at least 1 of the 3 major categories of nonpharmaceutical
interventions.
School closure
and
public gathering bans
activated concurrently represented the most common combination implemented in 34
cities (79%); this combination had a median duration of 4 weeks (range, 1-10
weeks) and was significantly associated with
reductions in weekly EDR.
The cities that implemented nonpharmaceutical
interventions earlier
had
greater delays in reaching peak mortality
There was a statistically significant association between
increased duration
of nonpharmaceutical interventions and a
reduced
total mortality
burden.
source
----------- see Graph
Some of the OTHER Interventions:
Transit Capacity Limited,
Warnings posted in Theatres
Interventions like those above will be particularly
hard to
implement in the US
when there was a record
53 million low-wage workers in 2019, 44% of all active workers in the
United States.
More than half were women. Two-thirds were in their prime earning years. 40%
were supporting children at home.
They earned a median
annual salary of $17,950.
The 1918 influenza
pandemic: Lessons for the future
September through November 1918, influenza and pneumonia sickened 20% to 40% of
U.S. Army and Navy
1918 Flu Pandemic Comparison of 4 cities - School Closure
and Public Gathering Bans vs Isolation & Quarantine.
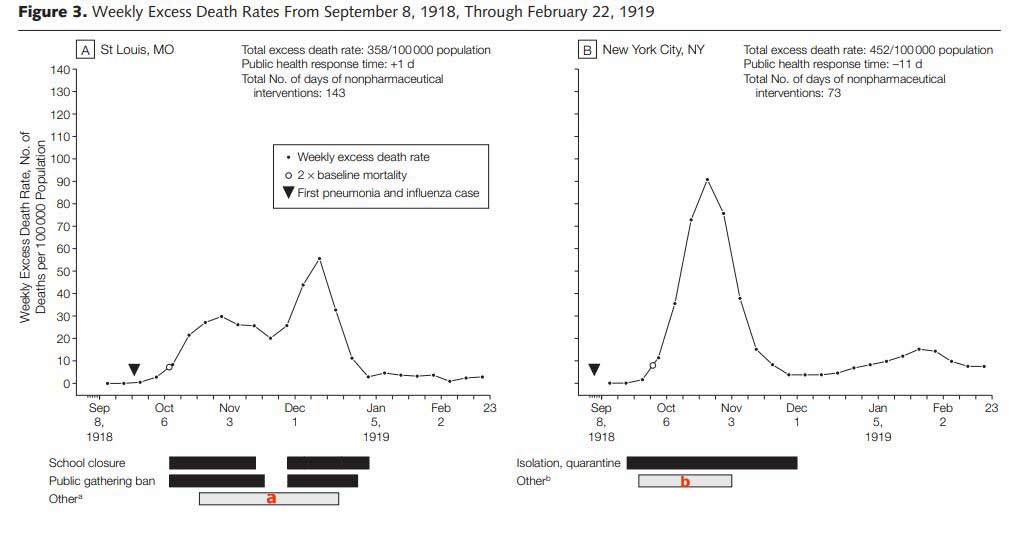
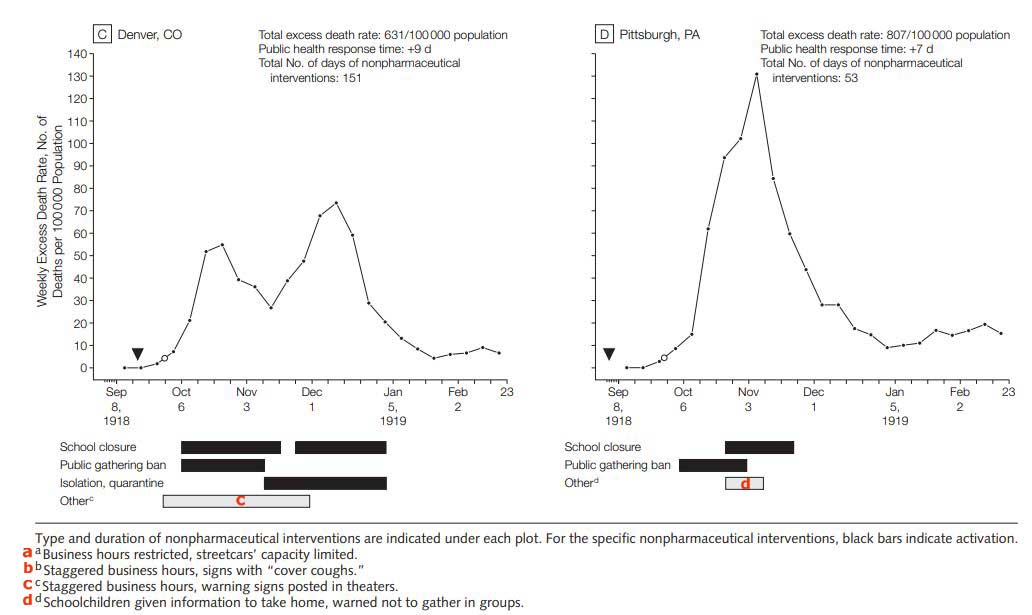
Exemplified by St. Louis and Denver
They gave up
on School Closure and
Banned Gatherings
after about 6 weeks which resulted in a 2nd
Peak higher than the first !!
If you don't keep the:- Schools
closed and Public Gatherings Banned for 3 months continuously
you'll get a spike in the 2nd half higher than the first !
Sustained interventions are beneficial and need to be
“on” throughout the particular peak of a local experience.
Many of the 43 cities in the study experienced 2 peaks
of excess pneumonia and influenza mortality.
Peaks frequently followed the sequential activation,
deactivation, and reactivation of interventions, highlighting the
transient protective nature of interventions and the need for a sustained
response.
For example, Denver(cumulative EDR=631/100 000 population) responded
twice with an extensive menu of interventions
that included public gathering bans, school closure, isolation and quarantine,
and several ancillary interventions and these actions are reflected temporally
in its 2-peak mortality curve.
In dual-peaked cities, activation of interventions was followed by a diminution
of deaths and, typically, when interventions were deactivated, death rates
increased.
source Page
651
But these 2 cities with 358 and 631
deaths per 100,00 and peaks of 60 and 70 had lower peaks than (452 peak 90) for
New York( with no ban on Gatherings nor School closings) and (807 peak
130) for Pittsburgh ( prematurely allowed Gatherings and was late in closing
schools) .
But why didn't Denver(631) beat New York(452) in
Total Mortality
Burden?
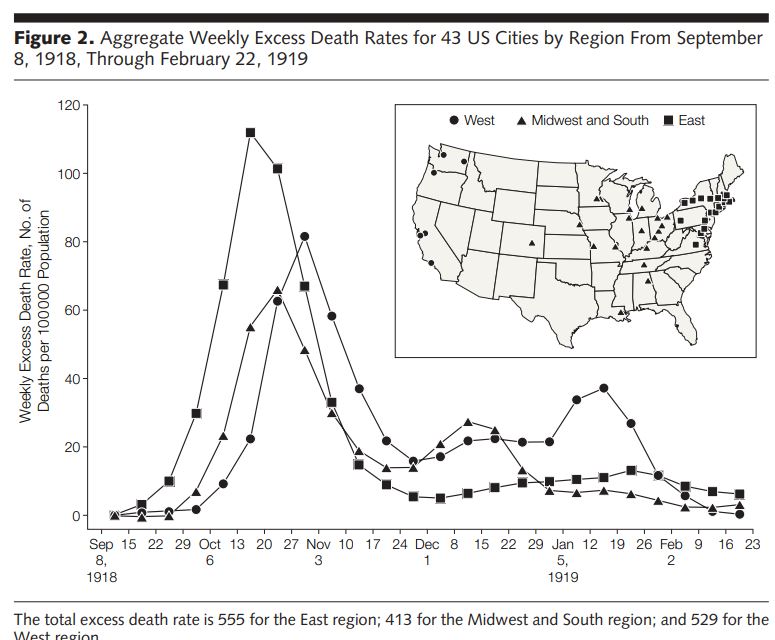
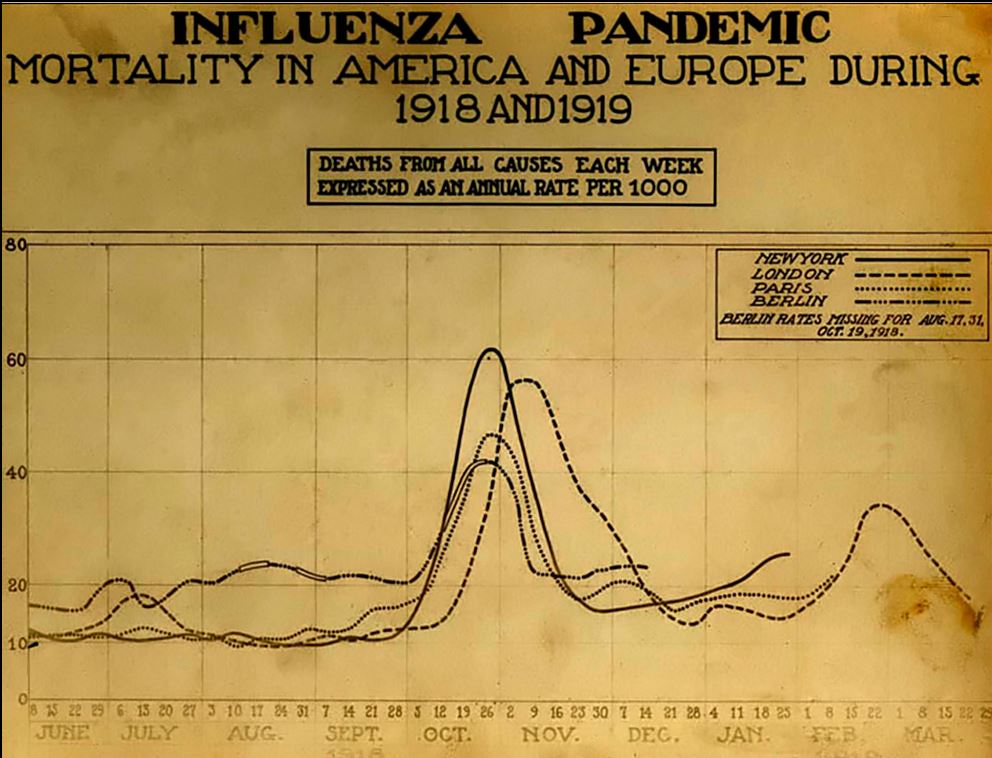
Deadly second wave ( Don't
see much of a First Wave? )
The second wave of the 1918 pandemic was much
deadlier than the first.
The first wave had resembled typical flu epidemics;
those most at risk were the sick and elderly, while younger, healthier people
recovered easily.
By August, when the
second wave began in France, Sierra
Leone, and the United States,[93] the virus had
mutated to a much deadlier form.
October 1918 was the deadliest month
of the whole pandemic.[94]
This increased severity has been
attributed to the circumstances of the
First World War.[95] In civilian life, natural
selection favors a mild strain. Those who get very ill stay home, and those
mildly ill continue with their lives, preferentially spreading the mild strain.
In the trenches, natural selection was reversed. Soldiers with a mild strain
stayed where they were, while the severely ill were sent on crowded trains to
crowded field hospitals, spreading the deadlier virus.
The second wave began, and the flu quickly spread
around the world again. Consequently, during modern pandemics, health officials
pay attention when the virus reaches places with social upheaval (looking for
deadlier strains of the virus).[96]
The fact that most of those who recovered from first-wave
infections had become immune showed that it must
have been the same strain of flu. This was
most dramatically illustrated in Copenhagen, which escaped with a combined
mortality rate of just 0.29% (0.02% in the first wave and 0.27% in the second
wave) because of exposure to the less-lethal first wave.[97] For the rest of the
population, the second wave was
far more deadly; the most vulnerable people were
those like the soldiers in the trenches – adults who were young and fit.[98]
source
Bats
During flight, a bat's body temperature spikes to over 100 degrees Fahrenheit.
Its heart rate can surge to more than 1,000 beats per minute.
"For most land mammals, these are signals that would trigger death," Bats live
it every day.
Bats have dScientists
discover six new coronaviruses in batseveloped special immune systems
to deal with the stress of flying.
Their bodies make molecules that other mammals don't have, which help repair
cell damage. And their systems don't
overreact to infections, which keeps them from falling ill from the many
viruses they carry (and also prevents conditions like diabetes and cancer).
This shows that it's not always the virus itself but the body's response
to the virus that can make us sick.
Even though bats may be the source of viruses that affect humans, they could
also be the
source of potential therapies
if we study their immune systems.
source
April 14: Scientists
discover six new coronaviruses in bats
May 6th
bats can carry the
MERS
without getting sick--research
to see if humans can do it too?
Postmortem
What went wrong with coronavirus testing in the U.S.
The missing six weeks: how Trump failed the biggest test of his life
|
